This semester I started my second year as a PhD student. We are diving right into the deep end of the pool with advanced regression.
For my students who might be reading this blog, yes I get to struggle through courses just like you 🙂
Our other project in this class is to learn R. I am extraordinarily thankful that I took an R seminar with CARMA earlier this year.
Our first assignment had us doing some basic manipulation. Now, moving onto our second assignment, I have decided to use my own data set and had some issues with cleaning my data file to be imported. Namely, I had cells with missing data but I had over 40 variables in the file and did not want to manually recode each row with an “NA” statement.
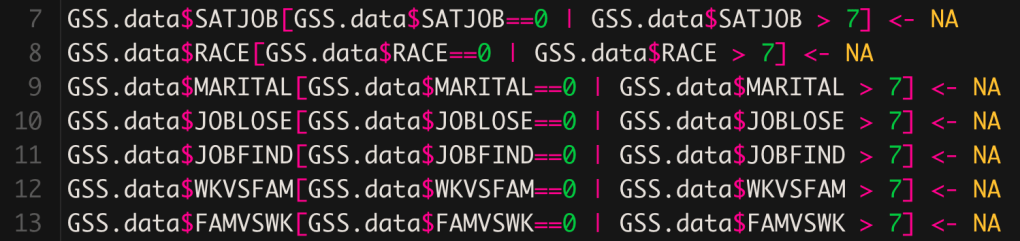
This sample code is useful if you have to transform a cell. In our practice data set values for certain responses might be irrelevant if they were > 7 because they indicated a response that was non continuous to be counted in regression. Example: How many years were your parents in school with a numeric selector but then 8 = “I don’t know.”
That was not my problem.
I knew all my data was continuous, I just had some missing cells.
So, after 30 minutes of Googling I found a fairly elegant solution to my problem to import the data set and assign “NA” to empty cells in one line of code.
my.data <- read.csv("file.csv", header = TRUE, sep = ",", dec = ".", na.strings=c("","NA"))
I have bolded the important part. Also, in the above code, you should make sure to set your working directory first and file.csv should be the exact name of your file.
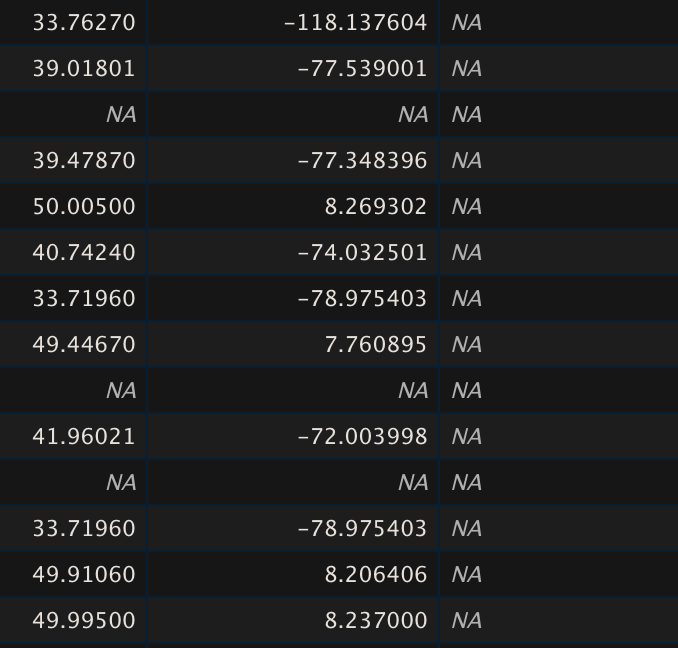
What I realized shortly thereafter was that some of these variables were irrelevant. You can see in the example above there is one entire columns of NA which is an empty column I did delete from the original file. The survey tool had also automatically added things like the lat/long coordinates of the user who completed the survey. If I kept these columns with NA in there, then I could not run an na.omit script on my code to do listwise deletion.
So….
I found a solution to remove specific columns from my dataset to remove the problem. NOTE: This requires you install the dplyr package.
install.packages("dplyr")
library(dplyr)
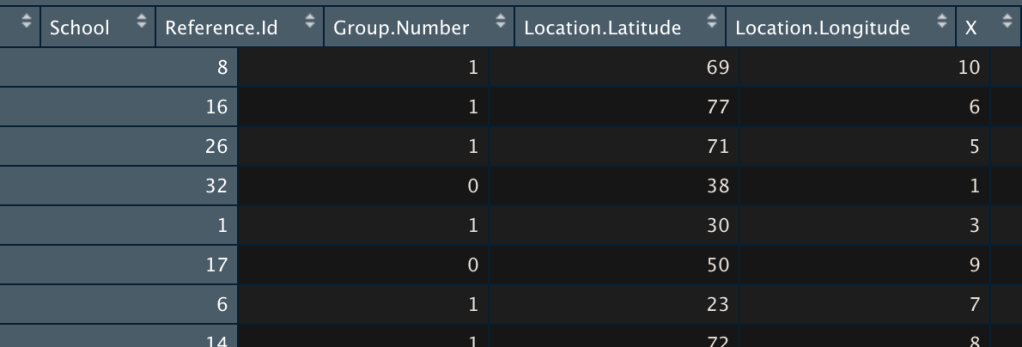
mynew.data <- my.data[ -c(4:11) ]
What this illustrates is a simple way to remove columns 4 through 11. It helps that I can see my original data on an excel sheet and I am very familiar with it. I struggled in our first assignment because it is a mega survey with hundreds of items and over 50,000 cases. I really would not have been able to see or fix this problem in that data set, at least not yet.
Still wondering how you can see your data after import to see your columns?
It’s easy. Just click on the blue arrow of the data frame.

R studio will then show you a spreadsheet.
It’s a good idea after any import to scroll through this especially to see any issues with header names and missing values.